

Introducing the Network Overview dashboard for the Flow network
This story first appeared in blog.metrika.co.
We are thrilled to unveil the latest addition to our suite of tools for the Flow Network: the Network Overview dashboard. This dashboard is designed to provide transparency and valuable insights into the health and performance of the network. It is the first public facing dashboard providing real-time insights of key metrics of the Flow network.
Metrika and the Flow Foundation have a long-standing partnership that’s evolved to serve the growing needs of the Flow ecosystem by developing innovative solutions that support Flow. Last month, we released the first Node Monitoring Platform built for web3, which has already seen significant adoption by the Flow community. Today, with the Network Overview dashboard hosted by Metrika, we are taking our partnership to the next level, enabling the Flow community to access critical information about the network in real-time.
Unlocking real-time insights
The Network Overview dashboard is a powerful tool that provides transparency and real-time insights into the health of the Flow Network. It includes several charts that track critical metrics related to the network's status and performance, including:
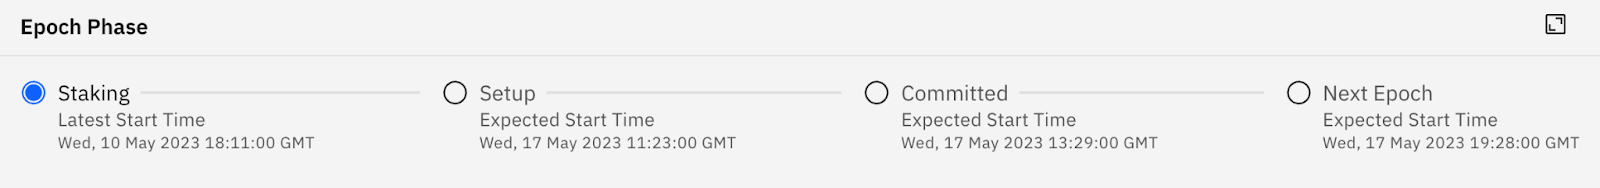
- Epoch Phase: An Epoch is a period of time when the node operators in the network are constant. At epoch boundaries, newly staked node operators are able to join the network and existing node operators which have unstaked may exit the network. The Epoch phase panel displays the epoch phase the network is currently in and provides an ETA for the next phases of the current epoch and when the next epoch will start. Operators, delegators, and stakers can refer to this panel and plan their next staking and delegation request accordingly.
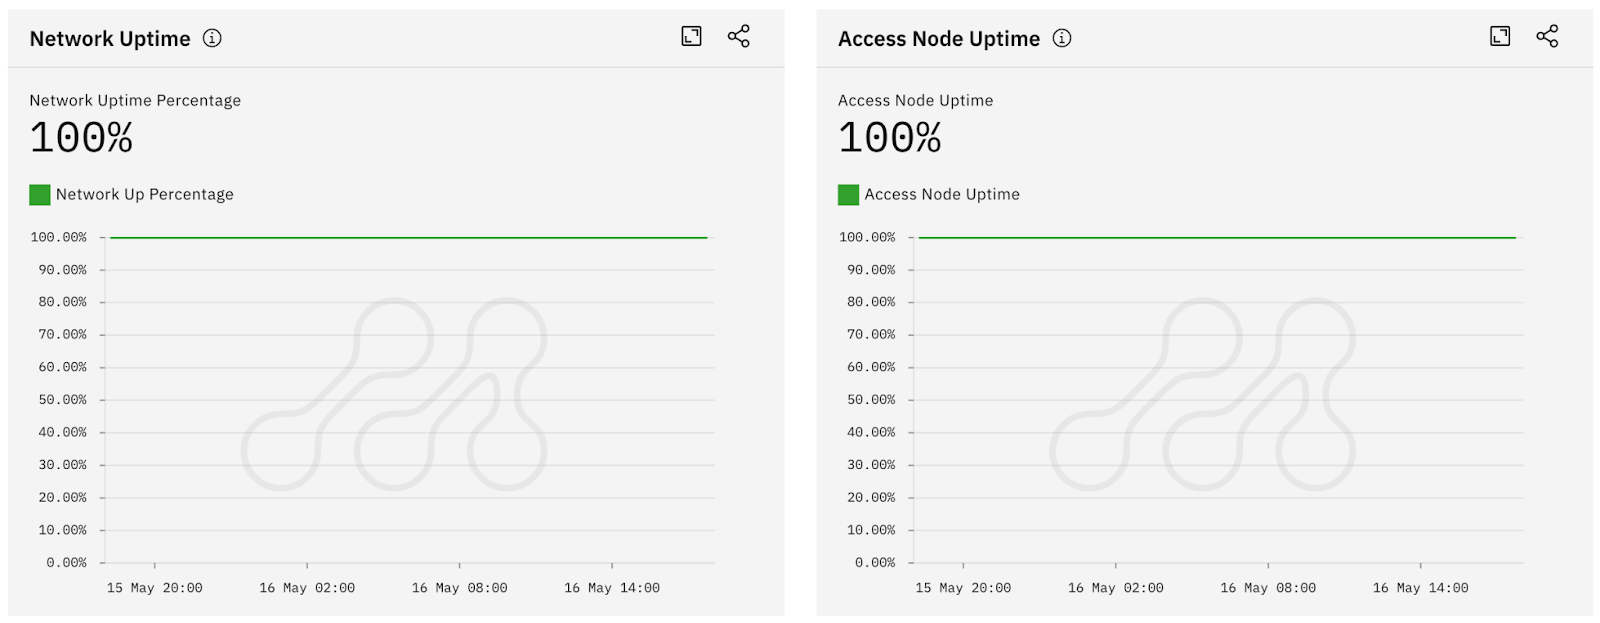
- Network & Access Node Uptime: Monitors the uptime of the network and access nodes respectively. The network uptime is derived from the four core metrics described below. The access node uptime shows the availability of the Access API served by the public access endpoint.
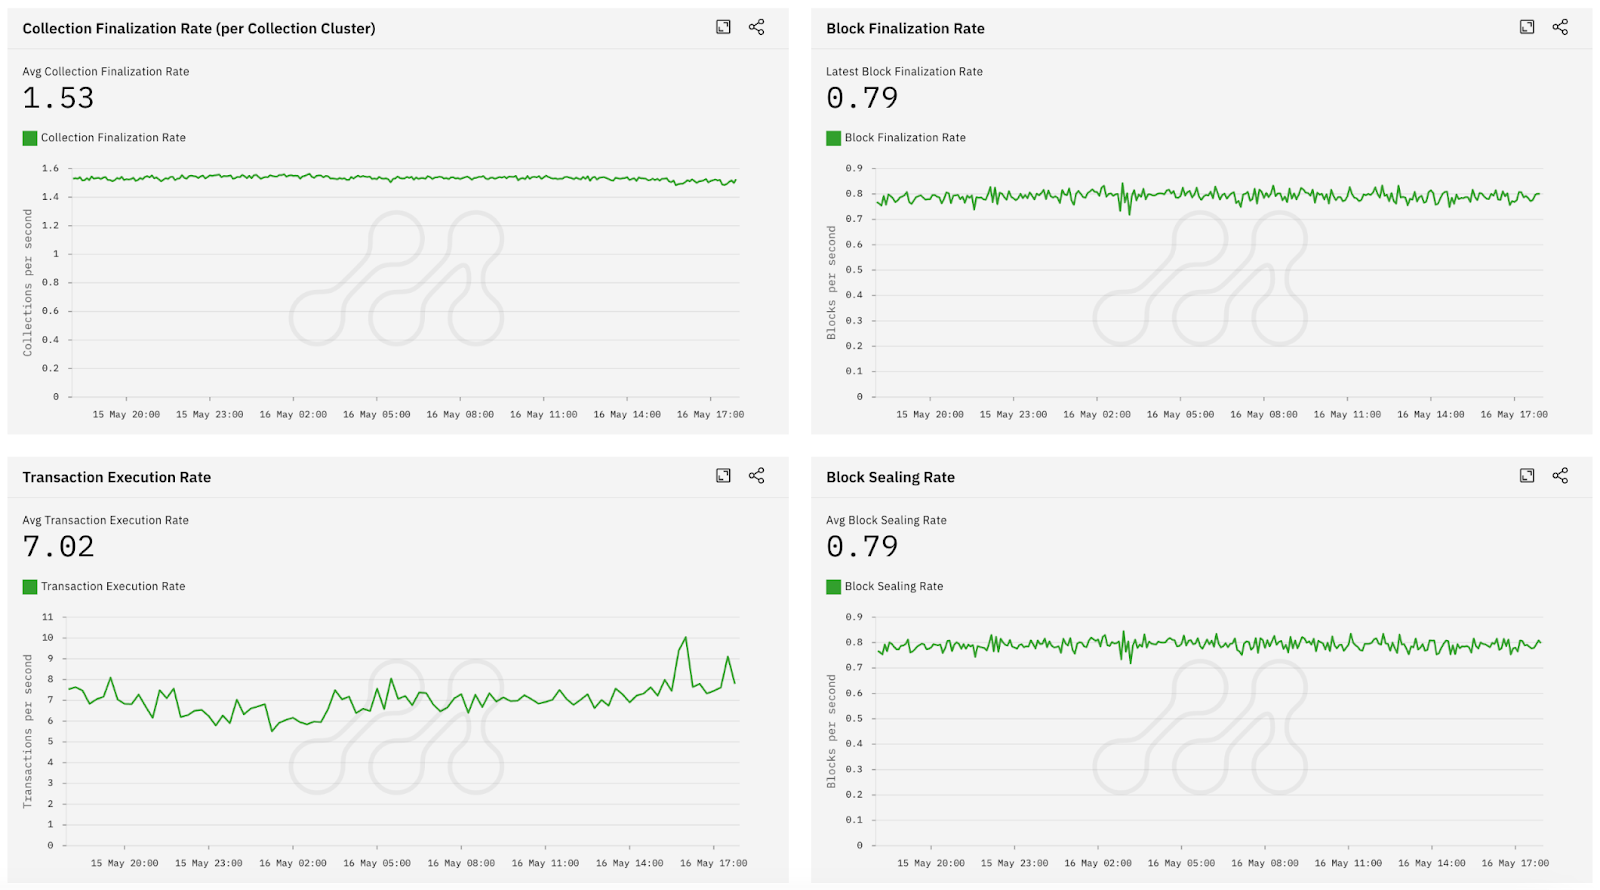
- Core metrics: Flow has a multi-role architecture, and correspondingly the status of the network is defined by taking into account the status of the different components that make up Flow. The core metrics provide key performance indicators for the four core processes – collection finalization by the collection nodes, block finalization by the consensus nodes, transaction execution by the execution nodes, and block sealing by the consensus nodes after the verification nodes have verified the execution results.
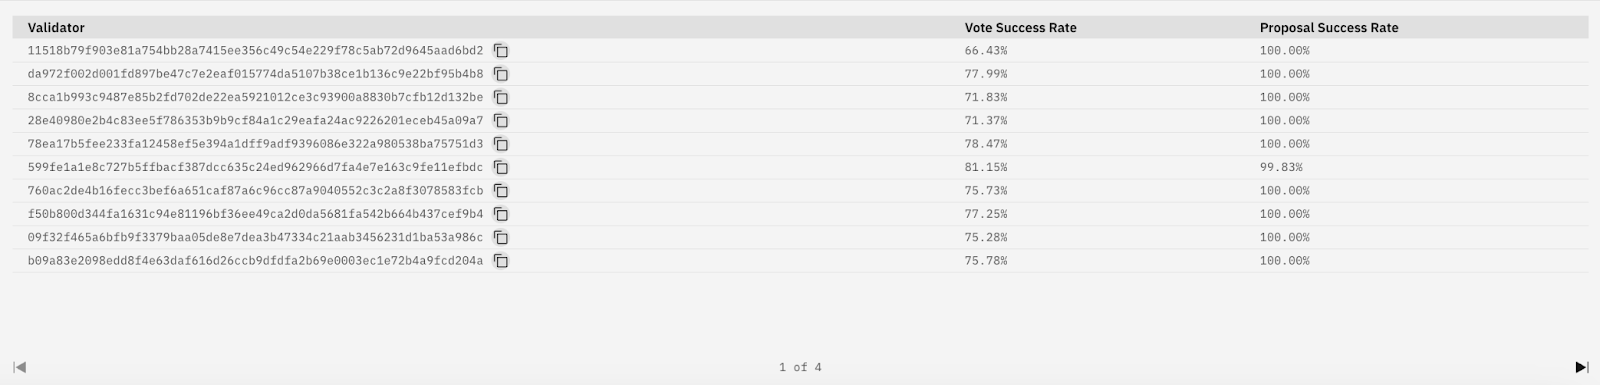
- Consensus leaderboard: In the Flow network, the consensus nodes run the consensus algorithm and are responsible for block production. The consensus leaderboard ranks individual consensus nodes based on their success rate in voting and proposing blocks, helping the community identify the nodes that are the most reliable and make informed decisions about staking and participation in the network.
Making life easier for the Flow community
The Network Overview Dashboard makes life easier for the Flow community by exposing unique metrics not previously available in other dashboards and fostering a more open and collaborative environment.
- Node operators can identify areas for improvement and make data-driven decisions about their node operations, ultimately improving the network's overall health and performance.
- Node operators, stakers, and delegators can make an informed decision about staking operations and plan accordingly.
- Developers get access to the insights they need to build more reliable and efficient applications on top of the Flow network.
- Overall, everyone in the Flow community gets insights into the network health and key metrics.
What’s next for Metrika on Flow
The Network Overview dashboard is the first of many more public-facing Flow dashboards to follow. In the next few months, Metrika will introduce more dashboards so everyone in the Flow community can glean insights into the performance and key events of the Flow network.
How to get started
Access our Network Overview dashboard here and visit our Knowledge Center to learn more about each metric.
If you have any feedback or suggestions about new metrics, please don’t hesitate to contact the Metrika team via Email, Discord, or Twitter to help improve the monitoring dashboards and the value we provide to the Flow community.
Interested in building on Flow? Visit Flow’s developer portal to get started, and keep in touch with the Flow community on Twitter or Discord.